

Most organizations collect large volumes of cybersecurity and IT risk data, but few translate that data into meaningful executive decisions. Security tools generate alerts. Ticketing systems track issues. Compliance programs produce evidence. Vendor reviews create questionnaires and reports. Yet when leadership asks, “What’s our exposure?” or “Where should we invest next quarter?” Many teams still respond with activity metrics instead of decision-ready insight.
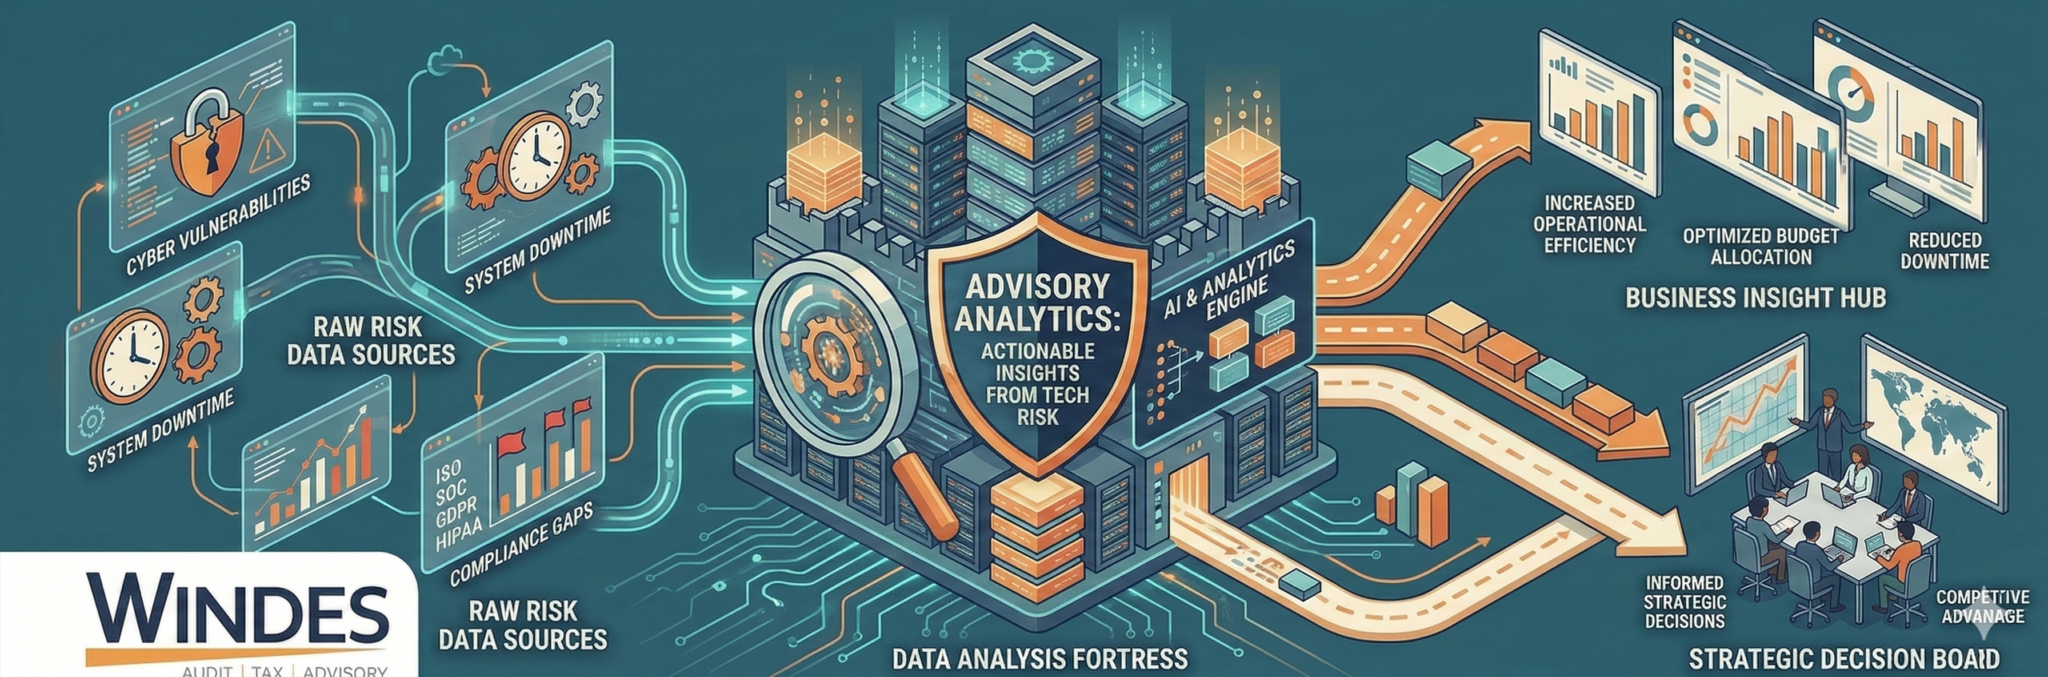
That gap is exactly what advisory analytics is designed to solve. It takes the outputs of your security, compliance, and IT operations and turns them into risk analytics and IT risk analytics that leadership can actually use: what matters most, what’s trending, what’s financially material, and what decisions are needed.
For CIOs, CROs, CEOs, and IT Directors in mid-market organizations ($10M–$500M revenue), advisory analytics is increasingly necessary because expectations are rising faster than headcount. Boards want clarity, not dashboards. Insurers want defensible risk posture. Customers want proof of control maturity. And the financial impact of breaches remains material, IBM reports the global average cost of a data breach is USD $4.4M in its 2025 Cost of a Data Breach Report. (IBM)
This guide explains advisory analytics in the context of technology risk, why mid-market organizations struggle to operationalize it, and a practical roadmap to implement data-driven risk management that improves governance, compliance, and strategic decision-making.
What Is Advisory Analytics in the Context of Technology Risk?
Advisory analytics is the structured approach to transforming technology risk data into decision-ready insights that align with business priorities, risk appetite, and executive reporting needs. It’s not just “better dashboards.” It’s analytics designed to answer executive questions with clarity and consistency: What is the risk? How big is it? What is changing? What should we do next?
Advisory analytics differs from:
- Standard reporting, which often focuses on operational activity (counts, tickets, status updates)
- Security tools dashboards, which can be valuable but are typically tool-centric rather than business-centric
- Raw compliance documentation, which proves controls exist but doesn’t always quantify exposure or prioritize actions
The value is in the bridge: translating technical signals into business risk decisions.
Advisory analytics is not just “better dashboards.” It’s analytics designed to answer executive questions with clarity and consistency:
What is the risk?
How big is it?
What is changing?
What should we do next?
The Evolution from Reporting to Risk Analytics
Think of the progression in three levels:
- Traditional IT reporting = operational metrics (what happened)
- Risk analytics = prioritization and probability modeling (what could happen, and how likely)
- Advisory analytics = decision-ready insight aligned with business strategy (what matters most, what to do, and why now)
One reason this shift matters: breach impact is financially material, and executives are increasingly expected to oversee security and governance outcomes. IBM’s Cost of a Data Breach research is frequently used as a benchmark for understanding materiality and executive accountability for incident impact. (IBM)
Why Mid-Market Organizations Struggle with IT Risk Analytics
Mid-market organizations often have the data, but not the connective tissue to turn it into insight:
- Limited internal analytics capability (and limited time to build it)
- Disconnected systems (SIEM, ticketing, vulnerability scanners, GRC platforms, spreadsheets)
- Compliance-driven reporting instead of strategic reporting
- Board expectations for clarity without a standardized risk language
Common challenges
- Too many metrics, not enough insight
- No standardized risk scoring
- Inconsistent vendor risk visibility (See our third-party risk management article>>)
- No integration into enterprise risk management
Schedule an Advisory Analytics Consultation
The Core Components of Effective Advisory Analytics
1. Risk Identification & Normalization
Effective advisory analytics starts by consolidating and normalizing data across your environment:
- Aggregating security, compliance, and operational data (See our cybersecurity compliance advisory guide>>)
- Creating standardized scoring models (so risks can be compared consistently)
- Aligning findings to enterprise risk categories (so reporting matches how leadership thinks)
This is where IT risk analytics provides leverage: it enables normalization across disparate systems so “apples to apples” risk scoring is possible across business units, vendors, and technologies.
2. Quantification & Risk Scoring
Once data is normalized, advisory analytics shifts from “status reporting” to quantification:
- Likelihood and impact modeling (risk = probability × impact)
- Financial exposure estimation (even if directional)
- Scenario analysis (e.g., ransomware, vendor compromise, cloud misconfiguration)
Anonymized example (mid-market quantification)
A $75M healthcare organization used advisory analytics to quantify ransomware exposure by combining: (1) critical asset inventory, (2) identity and access control maturity, (3) endpoint coverage, (4) incident response readiness, and (5) downtime sensitivity for revenue-critical systems. The output wasn’t a generic heatmap, it was a quantified exposure narrative that supported insurance renewal negotiations and guided budget allocation toward the most impact-reducing controls.
3. Executive-Level Risk Visualization
Dashboards aren’t the problem. Misaligned dashboards are. Advisory analytics creates role-based reporting that’s decision-ready:
- Dashboards tailored to CIO vs. executive leadership vs. the board
- Trend analysis (direction and momentum) instead of point-in-time snapshots
- Translation of technical findings into business language (risk, exposure, downtime, financial impact)
Data-driven risk management requires executive-ready insight, not just operational reporting.
4. Integration into Strategic Decision-Making
Advisory analytics becomes truly valuable when it influences decisions leadership already makes:
- Budget allocation and investment prioritization
- Cyber insurance strategy and underwriting support
- Vendor selection and contract requirements
- M&A due diligence and integration risk planning
- Digital transformation initiatives and cloud governance
How Advisory Analytics Supports IT Governance and Compliance
Advisory analytics strengthens governance by giving leadership consistent, comparable risk reporting without drowning them in tool-level detail. It also helps operational teams by clarifying ownership, prioritization, and cadence.
Key governance and compliance benefits include:
- Alignment with governance oversight (clear accountabilities, escalation paths, decisions)
- Improved regulatory cybersecurity reporting (clear evidence tied to risk reduction outcomes)
- Stronger compliance posture through quantifiable controls (not just “pass/fail”)
Board attention on cyber risk remains high, and directors increasingly expect clearer visibility into enterprise risks, including technology and cybersecurity topics. (Harvard Law Corporate Governance Forum)
Schedule an Advisory Analytics Consultation
A Step-by-Step Approach to Implementing Advisory Analytics
Step 1: Establish Risk Objectives
Start with clarity:
- Define risk appetite (what leadership will accept vs. what must be mitigated)
- Align to executive goals (growth, uptime, customer trust, audit readiness)
- Identify critical assets (systems and data that matter most)
Step 2: Map Data Sources
Advisory analytics is only as strong as its inputs. Map and validate:
- Security tools (EDR, identity logs, vulnerability scanning, email security)
- Compliance documentation and evidence
- Vendor assessments and third-party risk data
- Incident logs and post-incident lessons learned
Quick checklist
- Are data sources centralized?
- Are scoring criteria consistent?
- Is data reviewed quarterly?
Step 3: Develop Risk Models & KPIs
Create models that leadership can rely on:
- Risk scoring formula (standardized across functions and vendors)
- Financial impact modeling (directional, then refined)
- Trend tracking metrics (exposure decreasing or increasing?)
Step 4: Build Executive Reporting Cadence
Cadence matters as much as content:
- Monthly operational review (what changed, what’s urgent)
- Quarterly board-level report (top risks, trends, decisions needed)
- Annual risk recalibration (update models based on new threats, systems, vendors)
Signs Your Organization Needs Advisory Analytics
Advisory analytics is usually triggered when leadership asks questions that operational reporting can’t answer well:
- The board is asking for clearer risk visibility
- You’re preparing for an acquisition or capital raise
- Cyber insurance scrutiny is increasing (more questionnaires, more proof)
- Digital transformation is accelerating (cloud, integrations, new vendors)
- Regulatory pressure is rising and reporting expectations are increasing
Organizations seeking data-driven risk management often realize their existing risk analytics are insufficient for executive decisions because they show activity, not exposure.
Frequently Asked Questions
What is advisory analytics?
Advisory analytics is the practice of converting technology risk data into decision-ready insights for leadership, combining normalization, risk scoring, trend reporting, and business context so executives can prioritize investments, reduce exposure, and govern cybersecurity and IT risk with clarity.
How is advisory analytics different from risk analytics?
Risk analytics focuses on measuring and modeling risk (likelihood, impact, scenarios). Advisory analytics builds on risk analytics by aligning those outputs to executive priorities, governance, and decision-making, turning models into reporting, cadence, and action.
What is IT risk analytics?
IT risk analytics uses data across technology operations, security, compliance, and vendors to measure and compare IT-related exposures. It helps organizations standardize scoring across disparate systems and prioritize the risks most likely to disrupt operations, financial performance, or customer trust.
Why is data-driven risk management important?
Because leadership decisions depend on clarity. Data-driven risk management helps executives allocate budget, set priorities, and demonstrate governance using consistent metrics, so security investments reduce the risks that matter most to the business.
How often should risk analytics be reviewed?
At minimum, review risk analytics quarterly at an executive level, with monthly operational reviews for high-risk areas. Recalibrate models after major changes (new systems, acquisitions, significant vendor additions, major incidents) and as threats evolve.
Conclusion & Next Steps
Advisory analytics transforms technology risk data into strategic intelligence. It moves organizations from “we have dashboards” to “we can make informed, defensible decisions.” For mid-market leaders, it’s a practical way to meet rising board expectations, improve insurance and compliance outcomes, and prioritize investments that measurably reduce exposure.
Windes differentiates advisory analytics by integrating it with governance, compliance, and executive strategy, not just tools. The goal is decision-ready reporting that supports real outcomes: reduced risk, clearer accountability, and leadership confidence.